Free
Data Quality Report
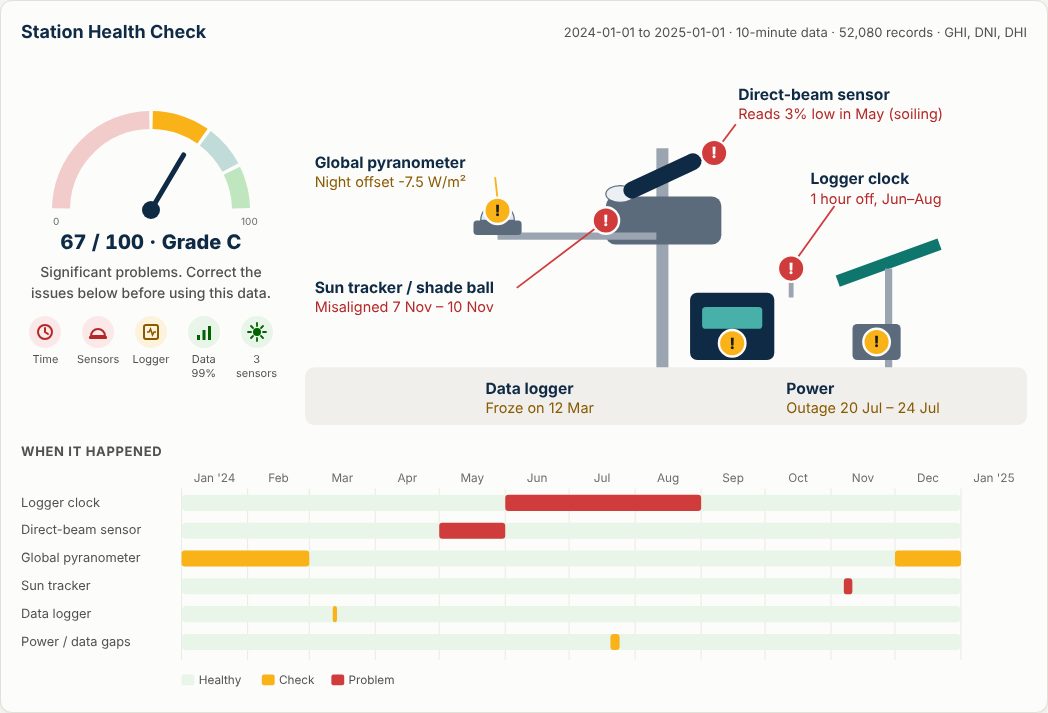
One station, one year of 10-minute data. Score, every problem found with dates, timing check, heatmaps, sensor balance and monthly table.



Weather data, diagnosed
A dirty, drifting or mis-timed sensor makes your PR, your yield estimate and your guarantees wrong, and wrong numbers cost money. SolarDoc checks your station's data, shows what it could be costing you, and prescribes the fix.
Every PR, every yield estimate and every guarantee starts with irradiance. A sensor that reads a few percent wrong still produces numbers that look normal, and the money leaks out quietly.
A sensor that reads low makes your PR look better than it is. Real losses go unnoticed and can't be claimed from your O&M or EPC contractor.
PR guarantees and liquidated damages are settled on measured irradiance. A faulty sensor puts you on the wrong side of the argument, or triggers claims that fall apart.
Soiling and losses read off a bad sensor send crews out on the wrong days and miss the real faults.
A few percent of doubt in the resource flows into the P90, debt sizing and the tariff you can bid. Lenders price in data they can't trust.
A 50 MWp plant whose reference sensor reads 3% low gets about 2,500 MWh a year of energy wrongly counted. At ₹3/kWh, that is about ₹75 lakh a year of losses you can't see or claim. Our free check estimates this for your own data.
More than a dozen automated checks on every record, plus diagnostics that explain what went wrong and when.
Wrong time zone, daylight-saving switches, clock drift and start/end-of-interval mix-ups, found by lining your data up with the sun.
Global, direct and diffuse must add up. We track the balance month by month to expose soiling, calibration loss and sensor swaps.
Readings above what the sun can deliver, negative irradiance and night-time light, flagged record by record.
Misaligned trackers and shade balls that no longer cover the diffuse sensor, with the days they happened.
Frozen channels, spikes, error codes, duplicates and gaps, with the exact dates to check in your maintenance log.
Night-time thermal offsets and data that is too coarse to check properly, explained in plain language.
Diagnosis, then prescription
SolarDoc doesn't just tell you what is wrong. For each fault it prescribes the fix and the equipment that stops it coming back, from time-synced loggers to heated, ventilated Class A radiometers. Request a quote straight from the report.
For operating plants
A dirty reference sensor makes a plant look better than it is. A wrong clock makes it look erratic. SolarDoc separates sensor faults from plant faults, so performance discussions are settled on facts.
Every station is compared with the rest of the plant. The odd sensor out is flagged with dates, and passing clouds are left alone.
See which class your monitoring meets today, and exactly which sensors, intervals or maintenance steps reach the next one. Free compliance check →
PR recalculated month by month from cleaned irradiance, next to what your SCADA reports, with the difference explained.
Trips, clipping and curtailment stand out once sensor errors are removed, so you know which losses are really the plant's.
Any logger export: Campbell TOA5, comma, semicolon or tab separated, 1-minute to hourly. Columns are detected automatically.
Latitude, longitude and time zone. If the time zone is wrong, SolarDoc tells you.
A 0–100 Data Quality Score, a prioritised list of problems with dates, charts, and a flagged CSV and PDF report to share.
Screen measurement campaigns early, fix problems while the station is still running, and go into financing with clean data.
Get a fast, consistent first pass on every dataset a sponsor sends, and focus your review where it matters.
Catch soiling, misalignment and logger faults on operating plants before they distort performance ratios.
Show clients a documented quality score for every delivery, and spot maintenance needs straight away.
All samples use simulated stations, so you can see the full output without sharing any data.
One station, one year of 10-minute data. Score, every problem found with dates, timing check, heatmaps, sensor balance and monthly table.
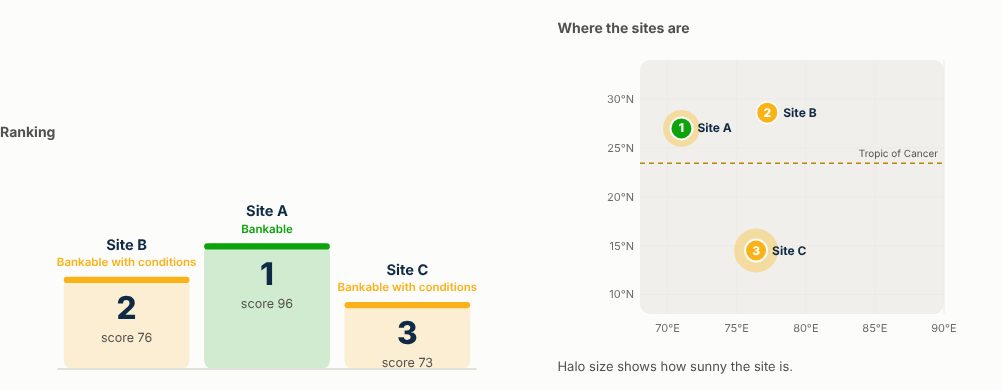
Three candidate sites ranked by a Bankability Score, with long-term P50 / P90, an uncertainty budget, and the actions needed to close the gaps.
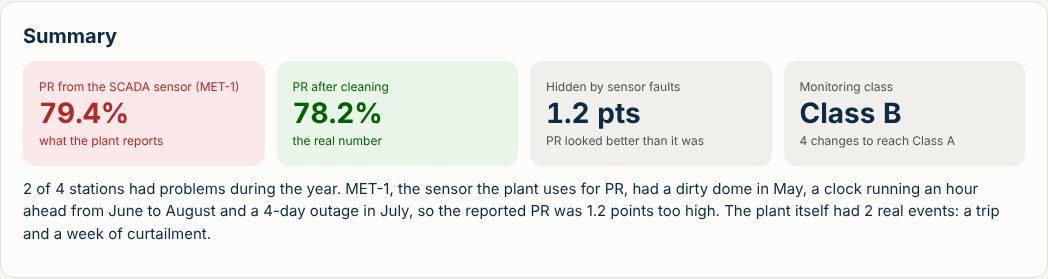
Four stations in a 50 MW plant compared, the monitoring class with what's missing, and PR recalculated from cleaned irradiance.
Launch prices Introductory prices for our first customers. Prices exclude GST.
₹0
A fast, private check of any station file.
₹1,999 per station
A full written report on one weather station, with an expert's note.
Your station against Himawari-9 satellite data, day by day: drift, soiling and clock errors that weather can’t explain.
₹4,999 per plant
For operating plants up to 50 MW: is your PR real, and which sensor is lying?
Every station in the plant checked against satellite data, so even a single sensor gets a second opinion.
₹9,999 per site
For developers taking a project to financing.
Long-term satellite record used to correct your short measurement period to a typical year.
Fill in the project sheet online, or download it for Excel. Have Solargis or similar data? Check it free.
Your plant's stations checked every day, with an alert on WhatsApp or email the moment a sensor starts lying, and a monthly PR report.
₹150 per MW a month
Minimum ₹1,500 per plant
Daily satellite comparison for every station.
Portfolios, consultancies and station networks: talk to us about batch reports, white-label reports and an API.
No. The free check runs entirely in your web browser. Your file is never sent to a server, so it is safe to use with confidential project data.
CSV or text exports from common data loggers, including Campbell Scientific TOA5. Comma, semicolon and tab separators, metadata lines above the header, unit rows, separate date and time columns, and missing-value codes such as −9999 or NAN are all handled. Time steps from 1 minute to 1 hour.
A time stamp and at least one irradiance column in W/m²: global horizontal (GHI), in-plane (GTI or POA), direct (DNI) or diffuse (DHI). Many plants have only GHI and GTI, or only GTI, and that works too. With GHI, DNI and DHI together, SolarDoc can cross-check all three, which is the strongest test of all.
GTI (the sensor at your module tilt) measures what your modules receive, so it is the right input for Performance Ratio. GHI (the flat sensor) is what satellite data, weather models and long-term records use, so it is what makes your site comparable and bankable. With both, SolarDoc converts GHI to the module plane and compares it with GTI every day: if they drift apart, one sensor is dirty, shaded or misaligned. With only GTI, SolarDoc still checks it against satellite data converted to your module plane, but adding a GHI pyranometer is the cheapest way to catch a lying sensor early.
It combines the share of records that pass every check, completeness, how stable the sensors stay against each other month to month, how many components are measured, and whether the time stamps are trustworthy. A (85+) is ready to use; D (below 50) should not be used without major correction.
It is a strong start. Bankability also depends on record length, a long-term reference, measurement uncertainty and documentation. SolarDoc Pro scores all of these and produces the report lenders expect.
Yes, free. The long-term data check reads typical-year and multi-year files from the common providers, PVsyst and EPW, and checks the time zone and time stamps, gaps, location, impossible values, whether direct and diffuse add up, and whether it agrees with your own station. You get a score and a list of questions to send your provider. The file stays in your browser.
A short project sheet: where the site is, plant size and design, what your weather station measures and when it was calibrated, and what your lender needs. Fill it in online or use the Excel version, then email it to us with your station data. No station yet? We can work from satellite data alone.
For every problem found, SolarDoc recommends the fix and the instruments that prevent it, such as GPS time sync for clock errors or ventilated, heated pyranometers for night-time offsets and dew. You can request a quote directly from the report.
No. It is a fast, consistent first pass that finds most problems automatically and tells an expert exactly where to look.